If you’re managing a website or server infrastructure, you understand how crucial uptime is to your business success. When servers go down, companies lose revenue, frustrate customers, and damage their reputation. That’s why businesses worldwide use server status checker websites to monitor their systems around the clock and catch problems before they impact users.
Whether you’re a small business owner running your first website or an IT professional managing multiple servers, choosing the right monitoring solution can make the difference between catching problems early and dealing with angry customers. In this guide, we’ll walk through the top free server monitoring tools and help you understand which one works best for your specific needs.
Server status checker websites function like digital security guards, constantly monitoring your infrastructure from multiple locations worldwide. When you set up monitoring, these services send automated requests to your servers every few minutes, checking not just if they’re responding, but how quickly they respond and whether they’re delivering content correctly.
The process works by having monitoring systems located globally ping your servers at regular intervals. If something goes wrong – whether it’s a complete outage, slow response times, or error messages – you’ll receive instant alerts through your preferred communication channels. This allows you to address issues before they turn into major problems that affect your users.
Modern monitoring services also learn what normal behavior looks like for your systems, so they can spot unusual patterns that might indicate developing problems. This proactive approach helps organizations prevent issues rather than simply react to them after they’ve already impacted operations.
Top 10 Free Server Status Checker Websites
1. UptimeRobot – The Popular Choice Among Website Owners

UptimeRobot has become one of the most widely used monitoring services among website owners and developers, and there’s good reason for its popularity. When you’re starting with server monitoring, UptimeRobot makes the entire process straightforward and accessible. The service monitors over 2 million websites globally, which shows both its reliability and the trust that SEO professionals and system administrators place in the platform.
What makes UptimeRobot particularly appealing is its generous free plan that allows you to monitor up to 50 websites with 5-minute check intervals. For most small to medium businesses, this frequency provides adequate coverage to catch problems quickly without overwhelming you with notifications. The platform’s global monitoring network ensures that your website performance gets tracked from multiple geographic locations, helping you identify regional accessibility issues that might affect specific user groups.
Organizations find UptimeRobot’s public status pages feature valuable because it enables transparent communication with customers during service disruptions. When you’re dealing with downtime, having a professional status page helps maintain customer trust and provides a centralized location for updates. The mobile app ensures that you stay connected to your monitoring data even when you’re away from your desk.
Key Features:
- Monitor up to 50 websites on the free plan
- 5-minute check intervals with upgrade options available
- Support for different protocols (HTTP/HTTPS, ping, port monitoring)
- Multiple alert methods, including email, SMS, and webhooks
- Public status pages for customer transparency
- 90-day data retention for historical analysis
- Mobile applications for iOS and Android
Please visit UptimeRobot to get started with their monitoring service.
Best For: Small to medium businesses needing reliable monitoring without budget constraints, organizations requiring public status pages for customer communication.
2. StatusCake – The Performance-Focused Option

StatusCake sets itself apart by focusing heavily on website performance monitoring alongside traditional uptime checks. While many services simply tell you whether your site is accessible, StatusCake provides detailed insights into how your pages load from different locations worldwide. This performance-focused approach makes it particularly valuable for organizations concerned with website performance optimization and user experience metrics.
The platform’s security features help it stand out from basic monitoring services. StatusCake includes virus scanning capabilities that help detect malware infections early, SSL certificate monitoring to prevent security lapses, and comprehensive performance analytics that identify optimization opportunities. These additional layers of monitoring provide a more complete view of your website’s health beyond simple availability metrics.
StatusCake’s ability to work with popular communication platforms like Slack and Discord makes it an excellent choice for development teams who need monitoring alerts integrated into their existing workflows. The service’s detailed reporting features help you understand performance trends over time and identify patterns that might indicate developing issues.
Key Features:
- Monitor up to 10 websites on the free plan
- Global monitoring from 30+ locations
- Comprehensive page speed analysis and optimization recommendations
- SSL certificate monitoring with expiration alerts
- Virus scanning and malware detection capabilities
- Integration with Slack, Discord, and PagerDuty
- Detailed performance reporting and analytics
Please visit StatusCake to explore their performance monitoring features.
Best For: Performance-focused websites requiring detailed speed analytics, organizations prioritizing security monitoring alongside performance tracking.
3. Freshping – The Team-Friendly Monitoring Solution

Freshping, developed by Freshworks, offers professional-level monitoring capabilities with an emphasis on team collaboration and user-friendly design. When your organization has multiple team members involved in server management, Freshping’s collaborative features become invaluable. The platform enables teams to share monitoring responsibilities, manage incidents collectively, and maintain consistent communication during service disruptions.
What makes Freshping attractive is its balance between powerful functionality and ease of use. The service provides 1-minute check intervals even on free accounts, which is better than many competitors and ensures rapid detection of issues. The platform’s custom-branded status pages help maintain professional customer communications while preserving your organization’s brand identity during service incidents.
Freshping’s API access makes it work well with existing development and operations tools, making it suitable for organizations with established DevOps practices. The service’s incident management features help teams track the complete lifecycle of service disruptions, from initial detection through resolution and post-incident analysis.
Key Features:
- Monitor up to 50 URLs with generous free plan limits
- 1-minute check intervals for rapid issue detection
- Global monitoring network spanning 10+ locations
- Team collaboration tools and shared dashboards
- Custom branded status pages for professional customer communication
- API for integration with existing tools
- Advanced alerting rules with team-based notification routing
Please visit Freshping to start with their team-friendly monitoring solution.
Best For: Development teams requiring collaborative monitoring capabilities, organizations needing professional customer-facing status pages with brand consistency.
4. LogicMonitor – The Smart Infrastructure Monitor

LogicMonitor represents a more advanced approach to infrastructure monitoring, incorporating artificial intelligence and machine learning to predict problems before they impact your operations. When you’re managing complex infrastructure that supports critical business operations, LogicMonitor’s predictive capabilities become valuable for maintaining high availability and performance standards.
The platform’s automated discovery features significantly reduce the work involved in comprehensive monitoring. As your infrastructure grows and evolves, LogicMonitor automatically identifies new components and configures appropriate monitoring without manual intervention. This capability is particularly valuable for organizations with dynamic environments where servers, applications, and services are frequently added or modified.
LogicMonitor’s unified approach means you can monitor everything from network devices to cloud services through a single interface, providing operations teams with complete visibility into their infrastructure health. The platform’s analytics help organizations understand capacity trends, plan for growth, and optimize resource allocation based on actual usage patterns.
Key Features:
- Comprehensive infrastructure monitoring, including servers, networks, and applications
- AI-powered anomaly detection and predictive analysis
- Automated discovery and configuration of new infrastructure components
- Advanced topology mapping and dependency visualization
- Predictive analytics for capacity planning and optimization
- Professional-level security controls and compliance features
- Extensive integration options for DevOps toolchains
Please visit LogicMonitor to explore their AI-powered monitoring capabilities.
Best For: Large organizations with complex infrastructure requirements, companies needing predictive monitoring and automated management capabilities.
5. Site24x7 – The Complete Digital Experience Monitor
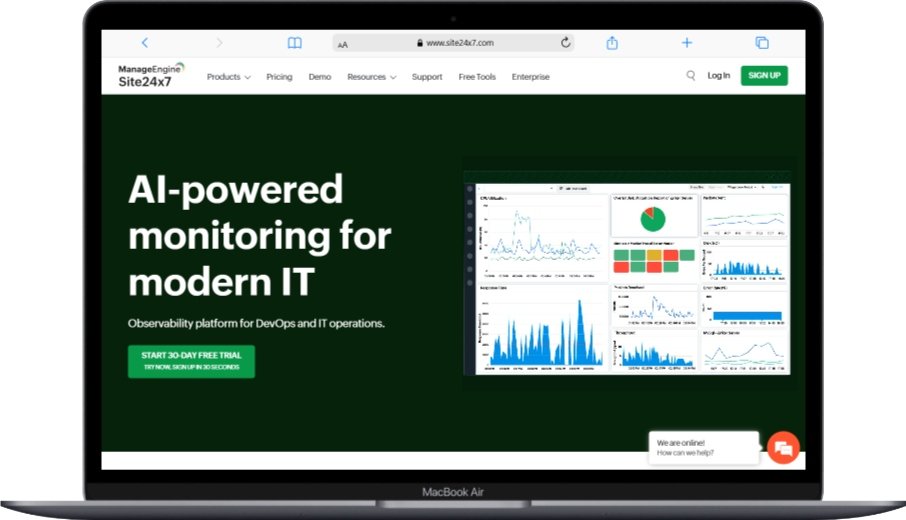
Site24x7 provides comprehensive digital experience monitoring that goes beyond traditional server monitoring to include user experience analytics, application performance insights, and business intelligence integration. When your organization needs to understand not just whether your systems are working, but how they’re impacting actual user experiences, Site24x7’s comprehensive approach becomes valuable.
The platform’s real user monitoring capabilities provide insights into how actual users experience your applications across different geographic regions, devices, and network conditions. This data complements synthetic monitoring results and helps you understand the real-world impact of performance optimizations and infrastructure changes. Site24x7’s global monitoring network spans over 130 locations, ensuring comprehensive coverage for organizations serving international audiences.
Site24x7’s application performance monitoring features enable development teams to identify code-level issues that might affect server performance, while specialized cloud monitoring provides detailed insights for organizations operating in multi-cloud environments. The platform’s mobile monitoring capabilities extend visibility to mobile applications, providing end-to-end digital experience analytics.
Key Features:
- Full-stack monitoring covering infrastructure, applications, and user experience
- Real user monitoring for actual user experience insights
- Synthetic monitoring from 130+ global locations
- Application performance monitoring with code-level visibility
- Specialized monitoring for AWS, Azure, and Google Cloud platforms
- Mobile application monitoring and analytics
- Custom plugins and extensive integration capabilities
Please visit Site24x7 to discover their comprehensive monitoring solutions.
Best For: Organizations requiring comprehensive digital experience monitoring, companies operating in multi-cloud environments with global user bases.
6. Checkmk – The Flexible Open-Source Solution
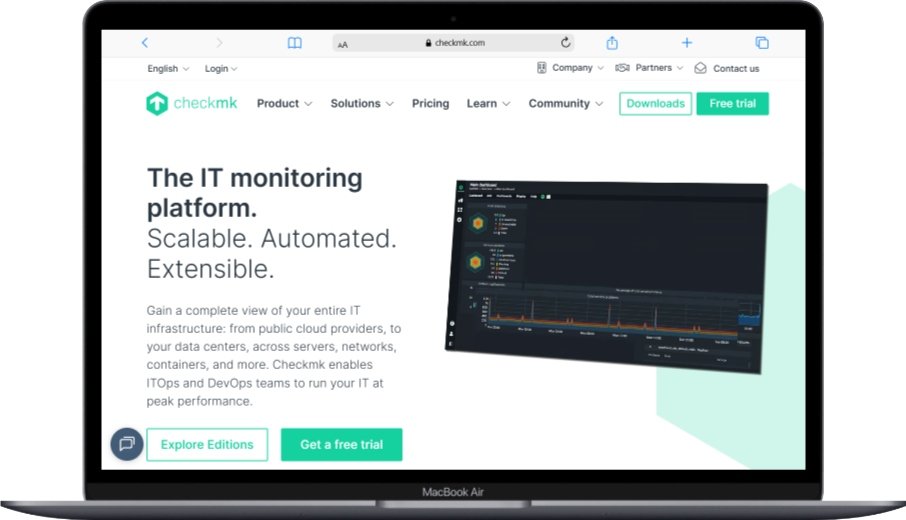
Checkmk represents a powerful open-source monitoring solution that combines community-driven development with professional-level capabilities. When your organization values flexibility and customization over out-of-the-box simplicity, Checkmk’s modular architecture provides the foundation for building sophisticated monitoring systems tailored to specific requirements.
The platform’s extensive plugin system allows you to monitor virtually any system or service, from traditional server infrastructure to modern containerized applications. Checkmk’s automated service discovery reduces setup complexity by automatically detecting and configuring monitoring for new systems as they’re deployed. This automation is particularly valuable in dynamic environments where infrastructure changes frequently.
Organizations appreciate Checkmk’s deployment flexibility, which includes both cloud-hosted and on-premises installations to meet various security and compliance requirements. The platform’s open-source foundation means you have complete visibility into how the monitoring system works and the flexibility to modify it as needed for specialized use cases.
Key Features:
- Open-source architecture with commercial edition options
- Automated service discovery and configuration
- Extensive plugin system for custom monitoring requirements
- Scalable architecture supporting large infrastructure deployments
- Flexible deployment options (cloud, on-premises, hybrid)
- Advanced notification systems with customizable escalation procedures
- Community-driven development with commercial support available
Please visit Checkmk to explore their flexible open-source monitoring solution.
Best For: Organizations requiring highly customizable monitoring solutions, companies with specialized monitoring requirements that benefit from open-source flexibility.
7. SolarWinds Server & Application Monitor – The Template-Rich Solution
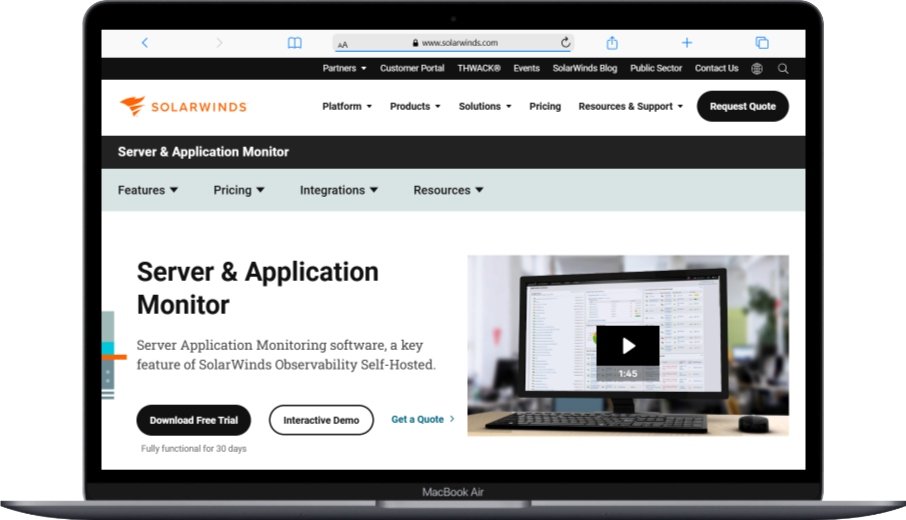
SolarWinds Server & Application Monitor delivers professional-level monitoring capabilities with over 1,200 pre-configured templates that dramatically reduce implementation time. When you’re managing complex business environments where rapid deployment is critical, SolarWinds’ template-based approach eliminates much of the configuration work typically associated with comprehensive monitoring solutions.
The platform’s dependency mapping capabilities provide visual representations of how different infrastructure components relate to each other, making it easier to understand the potential impact of failures and plan maintenance activities. SolarWinds’ extensive experience in network management shows in the platform’s sophisticated approach to root cause analysis and intelligent alerting that reduces notification noise while ensuring critical issues receive appropriate attention.
Organizations benefit from SolarWinds’ integration capabilities with existing IT service management platforms, ensuring that monitoring alerts flow seamlessly into established incident management workflows. The platform’s capacity planning tools help organizations prepare for growth by analyzing resource utilization trends and identifying potential bottlenecks before they impact performance.
Key Features:
- Over 1,200 pre-configured monitoring templates for rapid deployment
- Comprehensive dependency mapping and impact analysis
- Multi-datacenter monitoring with centralized management
- Intelligent alerting with customizable escalation procedures
- Integration with popular IT service management platforms
- Performance baseline creation and trend analysis
- Advanced capacity planning and resource optimization tools
Please visit SolarWinds Server & Application Monitor to explore their template-rich monitoring solution.
Best For: Large companies requiring rapid deployment of comprehensive monitoring, organizations with established IT service management processes needing seamless integration.
8. Pingdom – The User Experience Specialist

Pingdom has built a strong reputation in website monitoring by focusing on the connection between technical performance and user experience. When you need to understand not just whether your website is accessible, but how users actually experience it, Pingdom’s approach to monitoring provides valuable insights that extend beyond traditional uptime metrics.
The platform’s transaction monitoring capabilities allow you to monitor complex user interactions such as login processes, shopping cart functionality, and form submissions. This feature is particularly valuable for e-commerce websites and web applications where user experience directly impacts business revenue. Pingdom’s performance insights help identify specific elements that may be affecting website load times, providing actionable recommendations for optimization.
Pingdom’s mobile application ensures that system administrators and website owners can monitor their sites and receive alerts even when away from their computers. This mobility is crucial for small teams or solo administrators who need to maintain awareness of their systems’ status regardless of their physical location.
Key Features:
- Transaction monitoring for complex user workflow validation
- Detailed performance analysis charts and optimization recommendations
- Mobile applications for remote monitoring and alert management
- Page speed analysis with specific improvement suggestions
- Real user monitoring for actual visitor experience data
- Customizable alerting rules with intelligent escalation
- Integration with popular development and communication tools
Please visit Pingdom to explore their user experience monitoring features.
Best For: Web developers and businesses requiring detailed performance insights, organizations prioritizing user experience optimization alongside availability monitoring.
9. Datadog – The Comprehensive Observability Solution

Datadog provides comprehensive observability that extends far beyond traditional server monitoring to include application performance monitoring, log management, and security monitoring in a unified platform. When your organization operates complex, distributed systems where understanding the relationships between different components is crucial, Datadog’s correlation capabilities become valuable for effective troubleshooting and optimization.
The platform’s machine learning capabilities automatically detect unusual patterns and provide intelligent alerts that focus attention on genuinely critical issues while reducing notification noise. Datadog’s extensive integration system supports over 600 different technologies, making it suitable for organizations with diverse and complex technology stacks that require unified monitoring and observability.
Datadog’s real-time collaboration features enable teams to work together effectively during incident response, with shared dashboards and annotation capabilities that help maintain institutional knowledge about system behavior. The service’s advanced querying capabilities allow organizations to monitor business-specific metrics alongside traditional infrastructure metrics.
Key Features:
- Unified observability platform combining metrics, traces, and logs
- Machine learning-powered anomaly detection and intelligent alerting
- 600+ technology integrations for comprehensive coverage
- Real-time collaboration tools for effective incident response
- Custom metric creation and advanced dashboard capabilities
- Sophisticated querying and analytics for complex data analysis
- Automated root cause analysis and correlation
Please visit Datadog to explore their comprehensive observability platform.
Best For: DevOps teams managing complex distributed systems, organizations requiring unified observability across diverse technology stacks.
10. New Relic – The Developer-Focused Monitoring Platform
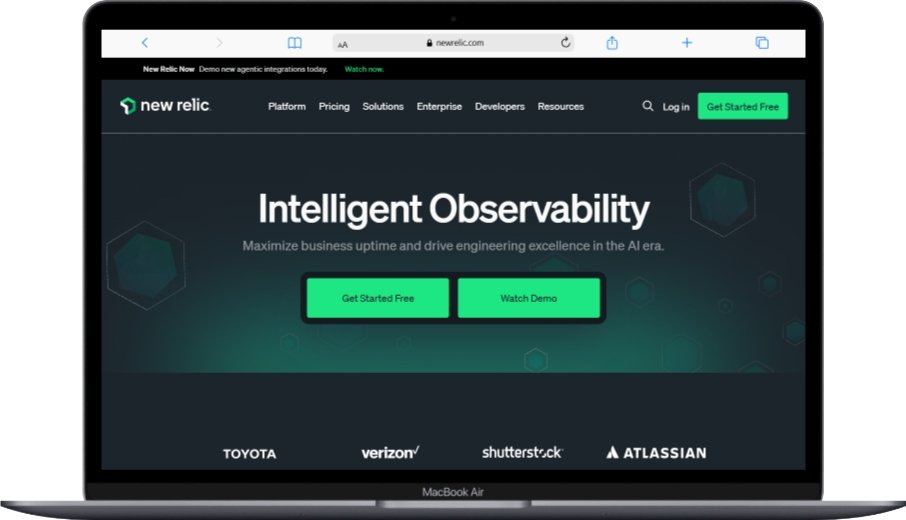
New Relic offers comprehensive observability with a strong emphasis on application performance and developer productivity. When your development teams need deep visibility into how application code affects overall system performance, New Relic’s code-level insights provide the detail necessary for effective optimization and troubleshooting.
The platform’s distributed tracing capabilities are particularly valuable for organizations operating microservices architectures and complex distributed systems. These features provide visibility into how requests flow through different system components, helping teams understand performance bottlenecks and optimize service interactions. New Relic’s focus on developer productivity includes features that help development teams identify and resolve performance issues more efficiently.
New Relic’s alerting intelligence uses machine learning to reduce false positives and ensure that notifications are actionable and relevant. The platform’s mobile monitoring capabilities extend visibility to mobile applications, providing insights into how mobile app performance affects user experience and business outcomes.
Key Features:
- Full-stack observability with detailed code-level insights
- Distributed tracing for microservices and complex system architectures
- AI-powered alerting intelligence with reduced false positives
- Comprehensive mobile application monitoring and analytics
- Business intelligence integration for performance-to-revenue correlation
- Developer productivity tools and workflow integration
- Advanced synthetic monitoring and user analytics
Please visit New Relic to explore their developer-focused monitoring platform.
Best For: Development teams requiring deep application performance insights, organizations needing strong business intelligence integration with technical monitoring data.
How These Services Actually Work Behind the Scenes
Server status checker websites operate through networks of monitoring nodes distributed around the world. When you add your website or server to a monitoring service, these nodes begin sending requests to your systems at regular intervals. The process involves more than simple ping tests – modern monitoring services perform full HTTP requests, check response codes, validate SSL certificates, and even verify that specific content appears on your pages.
The monitoring frequency varies between services, with some checking every minute while others check every five minutes on free plans. More frequent checks provide faster problem detection but also generate more data and potentially more alerts. Most services allow you to customize check intervals based on how critical different systems are to your operations.
When a monitoring service detects a problem, it typically performs additional checks from multiple locations to confirm the issue isn’t caused by a localized network problem. This multi-location verification helps reduce false alarms that could result from temporary network connectivity issues between a single monitoring node and your server.
Benefits of Using Professional Monitoring Services
Early Problem Detection and Prevention
One of the primary advantages of using professional server monitoring services is their ability to detect issues before they become major outages. These platforms can identify patterns that indicate potential hardware failures, network connectivity issues, or performance degradation trends. Early detection allows system administrators to address problems during maintenance windows rather than during peak usage periods.
Professional monitoring services also help identify security threats and potential cybersecurity vulnerabilities. Many platforms include features that detect unusual traffic patterns, failed authentication attempts, or other indicators of potential security breaches. This proactive approach to security monitoring can help prevent data breaches and protect sensitive customer information.
Comprehensive Performance Analytics
Modern server monitoring platforms provide detailed analytics that go far beyond simple uptime percentages. These services track response times from multiple geographic locations, helping identify regional performance issues that could affect user experience. Performance trend analysis helps organizations understand how their infrastructure performs under different load conditions and identify optimization opportunities.
The analytics provided by these platforms often include capacity planning insights that help organizations prepare for growth. By tracking resource utilization patterns and performance trends, businesses can make informed decisions about when to upgrade hardware, optimize code, or scale infrastructure to meet increasing demand.
Better Customer Trust and Communication
Maintaining high uptime percentages directly impacts customer satisfaction and business reputation. Professional monitoring services help organizations maintain service level agreements and provide the data needed to demonstrate compliance with customer expectations. Many platforms offer public status pages that provide transparency during service disruptions, helping maintain customer trust even during challenging situations.
The detailed reporting capabilities of these platforms also support business decision-making by providing concrete data about infrastructure performance and reliability. This information is valuable for capacity planning, budget justification, and demonstrating the business value of infrastructure investments.
Getting Started: How to Implement Server Monitoring
Setting Up Your First Monitoring System
When you’re implementing server monitoring for the first time, it’s important to start with clear objectives about what you want to achieve. Most organizations begin by monitoring their most critical systems – typically their main website, primary databases, and important applications. This focused approach helps you understand how monitoring works without becoming overwhelmed by too much data initially.
The setup process typically involves creating accounts with your chosen monitoring service and configuring basic checks for your critical systems. You’ll need to define what constitutes acceptable performance for your systems, including response time thresholds and uptime expectations. These baseline metrics help the monitoring system understand when to alert you about potential problems.
Most monitoring services provide setup wizards that guide you through the initial configuration process. You’ll typically need to provide URLs for website monitoring, server IP addresses for infrastructure monitoring, and contact information for alerts. Many services also offer mobile apps that make it easy to manage monitoring settings and receive notifications on your smartphone.
Configuring Alerts That Actually Help
One of the most important aspects of server monitoring is configuring alerts that provide useful information without overwhelming you with notifications. Effective alert configuration requires balancing sensitivity with practicality – you want to be notified of real problems quickly, but you don’t want to be awakened at 3 AM for minor, temporary issues.
Most monitoring services allow you to set different alert thresholds for different types of systems. Critical business applications might trigger immediate alerts after just one failed check, while less critical systems might require multiple consecutive failures before generating an alert. You can also configure different notification methods for different severity levels – perhaps email for minor issues and SMS for critical problems.
Many organizations find it helpful to start with more conservative alert settings and gradually adjust them based on experience. If you’re getting too many false alarms, you can increase the threshold for triggering alerts. If you’re missing important issues, you can make the alerting more sensitive.
Advanced Monitoring Strategies
Moving Beyond Basic Uptime Checks
While basic uptime monitoring is important, modern businesses often need more sophisticated monitoring approaches. Transaction monitoring allows you to verify that complex user workflows are functioning correctly – for example, checking that users can successfully complete a purchase process on an e-commerce website or that login functionality is working properly.
Performance monitoring goes beyond simple availability to track how quickly your systems respond to requests. This information is crucial for understanding user experience and identifying optimization opportunities. Many monitoring services can track performance from multiple geographic locations, helping you understand how users in different regions experience your applications.
Application performance monitoring takes this further by providing insights into code-level performance issues. These tools can identify slow database queries, inefficient code paths, and resource utilization problems that might not be apparent through external monitoring alone.
Integration with Development and Operations Workflows
Modern monitoring solutions increasingly integrate with development and operations workflows to provide more comprehensive visibility into system health. This might include integration with deployment pipelines to automatically monitor new releases, integration with ticketing systems to create incidents when problems are detected, or integration with communication tools to notify appropriate team members.
Many organizations implement monitoring-as-code practices where monitoring configurations are managed through version control systems alongside application code. This approach ensures that monitoring is updated automatically as applications are deployed and helps maintain consistency across different environments.
The goal is to make monitoring information easily accessible to the people who need it, when they need it, in the context of their existing workflows. This integration helps ensure that monitoring data actually gets used to improve system reliability rather than sitting unused in dashboards that nobody regularly checks.
Security and Compliance Considerations
Protecting Sensitive Information
When implementing server monitoring, it’s important to consider the security and privacy implications of the data being collected. Monitoring services may collect sensitive information about your infrastructure, including server locations, software versions, and performance characteristics. Understanding how monitoring providers handle this data, where it’s stored, and what compliance certifications they maintain is crucial for organizations with strict data security requirements.
Many monitoring platforms offer features that help maintain compliance with regulations such as GDPR, HIPAA, or SOX. These features might include data encryption, audit logging, user access controls, and data retention policies that align with regulatory requirements. It’s important to understand these capabilities and configure them appropriately for your organization’s needs.
Access Control and Authentication
Proper security configuration of monitoring systems includes implementing strong authentication mechanisms and appropriate access controls. Multi-factor authentication should be enabled for all administrative accounts, and access should be limited to only those team members who require it for their roles.
Role-based access control helps ensure that team members have appropriate permissions for their responsibilities without exposing sensitive information unnecessarily. Regular review of user access and permissions helps maintain security as team membership and responsibilities change over time.
Future Trends in Server Monitoring
Artificial Intelligence and Predictive Analytics
The future of server monitoring increasingly involves artificial intelligence and machine learning technologies that can predict failures before they occur and automatically optimize system performance. These technologies analyze historical data patterns to identify trends that might indicate impending issues, allowing for proactive intervention.
AI-powered monitoring systems can also automatically adjust alerting thresholds based on historical data and current context, reducing false positives and ensuring that alerts remain actionable. Some advanced systems can even automatically remediate certain types of issues without human intervention, further improving system reliability.
Cloud-Native and Container Monitoring
As organizations increasingly adopt cloud-native architectures and containerization technologies, monitoring solutions must evolve to handle the dynamic nature of these environments. Traditional monitoring approaches that rely on static server configurations are less effective in environments where resources are constantly being created, destroyed, and scaled automatically.
Modern monitoring solutions increasingly support automatic discovery and monitoring of containerized applications, service mesh monitoring, and integration with cloud-native deployment pipelines. These capabilities ensure that monitoring remains effective as infrastructure becomes more dynamic and distributed.
Making the Right Choice for Your Organization
Selecting the right server monitoring solution depends on several factors specific to your organization’s needs, technical requirements, and budget constraints. Small businesses might find that basic uptime monitoring meets their needs, while larger organizations with complex infrastructure might require comprehensive observability platforms with advanced analytics and integration capabilities.
Consider factors such as the number of systems you need to monitor, the frequency of checks required, the types of alerts you need, and how the monitoring system will integrate with your existing tools and workflows. It’s also important to think about future growth – a solution that works well today might not scale effectively as your infrastructure grows.
Many organizations find it helpful to start with a simple monitoring solution and gradually adopt more sophisticated tools as their needs evolve. This approach allows you to gain experience with monitoring concepts and practices before investing in more complex solutions.
The key to successful server monitoring lies not just in choosing the right tools, but in implementing comprehensive monitoring strategies that align with your business objectives and technical requirements. Whether you’re a small business owner looking to ensure your website remains accessible or a large organization managing complex distributed systems, the right monitoring solution can help prevent costly outages, optimize performance, and maintain customer trust.
Remember that effective monitoring is an ongoing process that requires regular review and optimization to remain effective as your infrastructure and business needs evolve. By implementing robust monitoring practices today, you’re investing in the reliability and success of your digital services for the future.
You May Also Like
 VPN
VPNCloudflare WARP as a Free VPN Alternative: Review After Months of Daily Use
 Proxies
10 Best Public DNS Servers for Faster Browsing and Lower Gaming Latency in 2026
 JavaScript
20 JavaScript Frameworks and Libraries for Modern Web Development
 WordPress
12 Best Cheap SSL Certificate Providers To Secure Your Website
 Proxies
Residential Proxies vs. ISP Proxies: What Actually Sets Them Apart
 Proxies
REST APIs Explained: Everything You Need to Know to Build and Use Them
 Proxies
Is CroxyProxy Safe to Use for YouTube? Privacy, Security, and Risks
 SEO Tools
50+ Best Free SEO Tools That SEO Experts Actually Use In 2026
 WordPress